Sunday, May 22, 2011

Stochastic & RSI

<<Stochastic>>

  Stochastic oscillator is another amazing indicators used by many traders, its phenomenon and mechanism of action is pretty easy, it is an excellent indicator for periods of oscillation (or no trend periods).


How to use it?
there are 2 ways to do that:
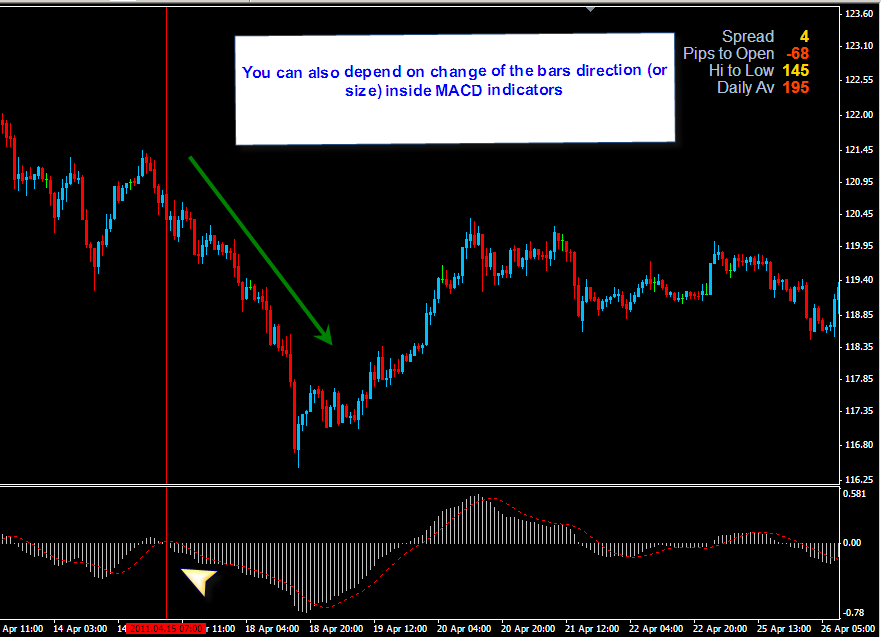
1- As a divergence indicator (and we have talked about divergence with MACD before).
2- Add 2 levels to the indicator, namely 20 & 80, whenever the price makes a new top and the 2 lines of the indicator crossed each other above the 80 level and it is in no trend period (and remember this well, as it is an indicator acting perfectly in no trend time on any time frame), then you enter short (sell) and vice versa in the long (buy) situation.


Case 1:-


Case 2:-


N.B:- Stochastic may give false signals in trend periods, and this is the most deficient point in the indicators, so try to identify no trend periods and zones before you apply its signals.


<<RSI>>

    Again RSI is another indicators on which big traders depend greatly!
it acts like stochastic but it is more popular, RSI is found on trading charts from expert traders.

How to use it?
there are 3 ways to do that (firstly you have to add 3 line levels 30, 50 and 70):
1- As a divergence indicator.
2- Used as an average indicator for saturation of price either oversold or overbought, so you can buy whenever the price makes a new bottom and the indicator line is near to level 30, this means that the price is overbought and you can enter a buy position, vice versa for the 70 level.
3- strong entry points can be obtained from cross of the powerful level 50, if it is from downwards to upwards you enter long and vice versa.


Monday, May 9, 2011

The indicators

<<Indicators>>

What are indicators?
- they are special oscillating tools present already in the trading software (built in) or programmed by a expert designers helping in giving clues or confirming the trading signals.

  Indicators have a bad reputation among forex traders, as they (most of them) follow the price and not vice versa, indicators give signals according to the price action, and as the price itself is dramatically swinging, sometimes their signals are false and confusing.
However, we can get the most desired benefit from them and learn how to navigate from their cheating signals.
   
Types of indicators
indicators generally are classified into 2 groups:
those good at trend time               &                 those good at oscillation or no trend time                                                                                             
eg. moving averages                                            eg. MACD, stochastic,RSI


<<MACD>>

moving average convergence divergence, this is its long form, as it depends on moving averages its composition, what interest us is how to use this easy & effective indicator, the best usage (as i think) among MACD is the divergence detection, let's define divergence first then discuss how it works and attach some examples:

Divergence
It is an indication that the direction of trend is about to reverse, it occurs when the price is moving in a specific direction while the indicator is moving in the opposite one, and this is not prevalent, because normally both price and indicators take the same direction, so if you noticed this on your chart predict a change in the direction soon, but it is clear it needs a confirmation as any other method.

N.B:- the 2 points matched together between tops/bottoms in either the price action or the indicate itself not necessary to be successive.


Friday, May 6, 2011

the great Fibonacci

<<Fibonacci levels>>

  You can check what are Fibonacci numbers in Wikipedia here: http://en.wikipedia.org/wiki/Fibonacci_number, in this topic we are not concerned with how did they emerge, but how will we use them in forex promptly, it is said that every thing on earth related to rates or ratios is linked by a mean or another to Fibonacci levels, so they resemble magic numbers, with super effects in our world.

Types:
Retracements, expansion, time zones, fan, arcs (again the most public used is retracement levels, so we will focus on the basics)

How to draw?
if the trend is ascending, so drag Fibonacci from bottom to top (recent or far, but recent ones give better results), surely if descending do the opposite thing, this video beneath will clarify how to drag Fibonacci correctly.


N.B:- the golden percent in Fibonacci is 61.8% which is already present in the metatrader standard options, it is noticed that most of retracement stop there, or break, and if it is broken, the trend is likely reversed.


Some examples of how Fibonacci perform very well in forex:


N.B:- retracement maybe from a distinct point or from an area as in above examples, so just wait for a confirmation by a reversal candle or helping indicator, then enter with the new direction (we will discuss the Japanese reversal candlesticks later on in this blog)

Thursday, May 5, 2011

Moving Averages

<<Moving Averages>>

  Again, one of the most common tools used by expert traders worldwide, on the run while you are surfing charts of deferent individuals with various strategies, you may find a moving average (or more) placed on the charts of more or less 80% of them, this signifies its effectiveness, although MA is a very simple indicator in interpretation of mechanism of action & understanding of the signals given by this great indicator, it is still of high value and can give a hint of the following direction of the market.

Types of MAs used:
- Simple, exponential, smoothed, linear weighted, each has its significance, but the most used ones are the simple & exponential (i prefer exponential, because it is more related to the recent prices).

Examples of the most important and successful values of MAs:
- 14 (which is the standard in metatrader), 20, 50, 100, 200.

Methods of usage of MAs:
- there are 2 main strategies to deal with MAs and get the desired benefit from them:
(1) cross of price
 here we wait until the price crosses the MA we selected either from downwards upwards so we enter long (buy) or the reverse, so we enter short (sell), actually this is a simple methods, but it needs confirmation.


(2) cross of 2 or more MAs
here we select 2 (or more) MAs one slow and the other is fast for ex. 30 & 9, and we apply them on the same chart, we enter a position after their cross together (the rule is that the fast crosses the slow MA upwards or downwards according to the direction of trend).


N.B:- MAs give us a hint about the direction of the trend from their recent slope, if it is sharp, this means the trend is so strong and it is likely to continue the same direction for a following period of time, if it is flat, this means we are in a no-trend zone, by other words we are in an area correcting the rapid heavy previous move, so we here wait until the trend is clear again, or reverses its direction, enabling us to enter with the counter trend.

>>Among the negatives of MAs generally, is that they give a late decision or entry point, also they need confirmation by other methods, so it is better not to depend on MAs alone.

Sunday, May 1, 2011

Trend lines

   <<Trend Lines>>

  One of the most used tools on the charts of all markets all over the world is the trend line, as it indicates the market's direction and character, we will know how to draw a true trend line

How to draw a trend line?
  simply surf the chart to find any 2 lows or highs and select the trend tool then match between them, you can check the true mark present beside the "Ray" option (on the trendline properties) to make it extended, remove it to make it stop at the point you stop at.
N.B:- the more tops/lows the trend line is drawn the more power it gains, but at least 2 lows/tops, also the higher the time frame the stronger the trend line will be, for ex. an up trend on the "daily" chart will act more effectively than an up trend on 4H chart.

How to use trend line in trading?
  The most likely method using trend lines is waiting their brake, so this indicates a change in direction and you can enter in the opposite direction of the original trend, other method of usage is to wait until the price is near the trend and notice the price action there, as if it is a support/resistance line, so here you will maybe enter with the direction of the original trend, the following charts will clarify more:


N.B:- in the previous charts the trend line is supported on 5 low so it is very strong, so we expect a powerful movement after its break.

What is meant by retest of the broken trend?
  This is phenomenon oftent happen in forex, simply after breaking the trend (either ascending or descending) the price will reverse again for few pips to test the trend line i.e just touch it, before resuming the direction of break again.
Charts:


N.B:- it is not a condition that each break of trend is followed by a retest of the trend, but it often occur, and when occurred it gives a confirmation of the break, aslo you can divide your lots (sum of money) on 2 parts, one enter after the break immediately, and another after retest of the trend which is further confirmation.

Thursday, April 28, 2011

Classical analysis

Classical analysis comprises several items which help us analyze the market, i will enumerate them, then i will start clarifying each separately:
1- Support & Resistance.        2- Trend lines.        3- Moving averages.        4- Fibonacci levels.        5- Indicators.


<<Support & Resistance>>

Before we know what is meant by support/resistance levels, we have to know how does the price form the tops and bottoms through its movement, as those which form support & resistance points, or lines or areas which are of great value in forex.

Definition of top
It is a candle which mediates 2 candles on each side provided that their price do not exceed the middle candle price / do not reach its high.
Definition of bottom
It is a candle which mediates 2 candles on each side provided that their price do not exceed the middle candle price / do not reach its low.

The following charts will clarify what i mean


From the previous bottoms and tops support and resistance lines are formed respectively.

How can we benefit from the support/resistance lines?
The price respects support/resistance lines as it closes to them, so if we detected an old support on our chart, and the price at the moment is moving towards it, we will wait until it tests it or just touch it, then we will enter with the direction of trend, the same happens with resistance but on the opposite side, let's see together:


N.B:- when the support line is broken it turns to resistance, and vice versa.

Types of analysis

   OK, after we have learned how to put our feet on the first step of the stairs, we have to know when to buy and when to sell, actually this is the base on which all types of analyzing the market are based on, because if you knew the proper points of buy/sell you will make profit, that's easy.

Main techniques of a analysis
(1) Classical analysis             (2) Fundamental analysis             (3) Wave analysis
   We will give a short note about each method just to be oriented to the following information;
(1) It is the most used one, and among the most successful and easy methods too, it is concerned with using support & resistance points, trend lines, Fibonacci, price channels moving averages, indicators...etc (we will know each later on)
(2) It is the method which giant traders use, also big companies, institutions and banks depend on it, it is concerned with the economic news revealed by important people or in newsletters.
(3) It is a special type of analysis based on specific patterns which are known to be repeated in the market, they were first recognized by the great sir Ralf Nelson Elliott in 1930's & it depends on what happened in the past, and thought it will be repeated in the future.

N.B:- You can use either of the previous methods, or use a combination or even use them all, it is up to you, this depends on the trader's ability to understand each method and deal with it well, sure if you are perfect in 2 it will be better, because your image (view of the market) will be larger.     
In the next lesson we will start to explain the public classical analysis and how we benefit from it, now waiting to hear any questions..
Regards.